Our Culture

What you believe and what you value as an organization matters. Discover the DNA of our firm.

Our People

Get to know our teams and the stories of select staff members who share why they choose to work at Sands Capital.

News & Events

Read about some of the latest events, partnerships, and business highlights from Sands Capital.

Careers

At Sands Capital, we strive to hire exceptional talent who will live our values and support our efforts to deliver on our mission.

Changing market and geopolitical environments are part of the equation for long-term investors.  As active investors, we are prepared to manage through trying times.

Papercup’s proprietary AI dubbing solutions provide high-quality, inexpensive voiceover and video localization.

Fostering Long-term Thinking

Executive Managing Director and Sr. Portfolio Manager Brian Christiansen discusses the importance of candor and collaboration in a culture that promotes long-term thinking.

Transparent Work Cultures and Inclusive Opportunities

Recruit Holdings is transforming the world of work through wage transparency and providing life-changing opportunities for immigrants and refugees.

Philosophy & Approach

Our philosophy is rooted in the belief that, over time, stock prices will reflect the earnings power and growth of the underlying businesses.

Our latest annual report offers a comprehensive view of how we add value through active stewardship.

Public Equity

Our newest strategy takes an unconstrained approach to seeking the best growth businesses outside of the U.S.

Venture & Growth Equity

Sands Capital invests in innovative businesses across all stages of the growth spectrum

An Earnings-powered Recovery 

April 25, 2024

Markets seem to underappreciate what we see as the significant improvements many of our portfolio businesses have made to their underlying fundamentals. 

Key Points

  • Earnings growth drove recent investment results for our portfolios.

  • Waning competitive intensity and operational improvements are driving margin expansion among many of our businesses.

  • Valuations remain fair, and in some cases attractive, despite this improving earnings picture.

In the dynamic landscape of global equity markets, we were encouraged to see resilience and growth in the first quarter of 2024. Against a backdrop of uncertainty tied to fast-changing geopolitical factors, investor confidence seemed to be underpinned by strong fundamentals. What encourages us the most are the underlying catalysts fueling the upward trajectory. We’ve observed robust earnings growth, a widening breadth of participation, and a notable decoupling of equities from the direction of interest rates. Remarkably, growth stocks defied many expectations by flourishing even in the face of elevated yields on the 10-year Treasury note.

Exhibit 1

FUNDAMENTALS DROVE THE MARKET IN 2024’S FIRST QUARTER

Interest rates didn’t dictate the market’s direction in the first quarter, unlike in most of 2022 and 2023. Russell 1000 Growth vs. 10-Year Treasury Yield. 12/31/21 - 3/31/24.

Source: FactSet. Data as of 3/31/24.

We would be remiss if we neglected to acknowledge the so-called Magnificent Seven, the group of leading technology companies whose performance serves as a barometer for the broader market. Contrary to the uniformity observed in 2023, when these constituents appeared to move in lockstep, the first quarter unveiled dispersion within the group.

Importantly, growing disparities in their fundamental outlooks drove the divergent trajectories.

This nuanced break underscores the direction and sustainability of earnings growth. That key component is what matters for long-term investors like us, and what is so often overlooked in the short term.

Exhibit 2

DIVERGING FORTUNES FOR THE MAGNIFICENT SEVEN

Improving fundamentals largely drove investment results for the Magnificent Seven in 2024’s first quarter.

Source: FactSet. The Magnificent Seven is vernacular for a group of mega-cap stocks that are the largest weights in major stock indexes, such as the S&P 500 Index, Russell 1000 Index and MSCI ACWI. It is used to refer to the set of seven big technology stocks: NVIDIA, Meta Platforms, Amazon, Microsoft, Alphabet, Apple, and Tesla. The chart is for illustrative purposes only and is not intended to represent the performance of any Sands Capital holdings or strategy. These seven stocks do not represent an index, and this chart should not be used for comparison purposes as it does not present a fair and balanced representation of any particular investment or strategy. . Six-Month Earning Revisions represent the six-month percentage change in consensus estimates for earnings per share in the current unreported year (i.e., FY1). YTD Return reflects the individual security return from 12/31/23 through 3/31/24. Change in LT Exp. Growth Rate measures the percentage point change in FY3 vs. FY0 consensus earnings per share estimates over the trailing six months.

Earnings power is ultimately what we care most about at Sands Capital, given our business owner’s approach to investing. We don’t necessarily dwell on the day-to-day or even quarter-to-quarter swings in the market. Instead, we focus on the 30 to 50 businesses that we own in each portfolio and the influences on their earnings power. The market’s seeming reorientation to micro from macro has begun to reward our fundamentally oriented approach. But there’s still a way to go, in our view. As we close the first quarter, we want to draw attention to the specific improvements in the underlying fundamentals of many portfolio businesses that the market may not yet fully appreciate.

One of the clearest ways we have found to highlight this fundamental improvement is through our exposure to unprofitable businesses. Exhibit 3 shows our Global Growth strategy’s exposure to loss-making businesses since 2021’s third quarter, and each of our portfolios has followed a similar trajectory. This decline isn’t window dressing; we haven’t simply swapped unprofitable businesses for profitable ones. Instead, many of the businesses we own have begun to report positive results, as competitive intensity has fallen, and operational improvements have yielded margin-boosting efficiencies. Importantly, this improvement in profitability hasn’t come at the expense of growth.

Exhibit 3

PORTION OF GLOBAL GROWTH'S PORTFOLIO WITH NEGATIVE EARNINGS YIELD

Source: FactSet. All data as of 3/31/24 unless otherwise indicated. For illustrative purposes only. Values are those of the Global Growth Equity Composite. Earnings yield is the consensus non-GAAP (generally accepted accounting principles) earnings-per-share estimate over the next 12 months divided by the current share price. Forward earnings projections are not predictors of stock price or investment performance and do not represent past performance. Characteristics, sector exposure, and holdings information are subject to change and should not be considered as recommendations.

Our portfolios continue to feature higher earnings growth potential than their respective benchmarks.

Throughout 2022 as equities sold off globally, investors questioned the financial health of many of our high-conviction businesses. Unprofitable or barely profitable businesses were among our largest detractors from investment results. During that period, clients frequently asked why we continued to own these businesses, if they’d ever make money, and if they were broken growth stories. After re-underwriting all our businesses, we concluded that in most cases, their stocks had become disconnected from their fundamentals, that they were on a path to profitability, and that patience would ultimately be rewarded.

We aren’t claiming success, but we are encouraged by the progress these businesses have made in achieving profitability across our portfolios.

The fundamental improvement we’ve seen across our businesses—both profitable and unprofitable— has yielded attractive investment results across our strategies. These results have largely been driven by earnings growth, unlike the returns of the broader market, which have benefitted more from multiple expansion.

Exhibit 4

IMPROVING FUNDAMENTALS ARE DRIVING RECENT INVESTMENT RESULTS

Global Growth vs. MSCI ACWI. 1-Year Return Decomposition (3/31/23 – 3/31/24).

Source: FactSet. Chart uses monthly data as of 3/31/24. P/E expansion is the change in next 12 months’ P/E multiple. Inception date is 12/31/08. Returns are cumulative and calculated monthly. The investment results shown are net of advisory fees and expenses and reflect the reinvestment of dividends and any other earnings. The investment results are those of the Global Growth Equity Composite. Net of fee performance was calculated by reducing Global Growth Equity Composite's monthly gross return by 1/12 of the highest applicable annual fee of 0.85%. The MSCI ACWI is unmanaged, does not reflect the reinvestment of dividends and is not subject to fees and expenses typically associated with managed accounts or investment funds. Sands Capital may invest in securities not covered by the Index. Past performance is not indicative of future results. GIPS Reports found here.

Real-world Examples

DoorDash—the market-leading food delivery platform in the United States—is a prime example of this fundamental improvement. While not yet profitable, its net margin has significantly grown over the past four years, and we expect continued expansion through at least 2028.

We believe three interconnected elements are driving the business’ margin inflection: falling competitive intensity, improving unit economics, and new product expansion.

Falling competitive intensity: DoorDash’s market share nearly doubled since 2019. The end of “free money” has driven rationalization, discouraging new entrants from entering the market and attracting customers through discounts and other perks. As competition has rationalized, the existing market leaders entrenched their positions, which we believe has made it even less appealing for new entrants.

Improving unit economics: Stronger competitive positioning has resulted in less of a need to discount or engage in aggressive marketing tactics, which has improved the bottom line. Meanwhile, order frequency and engagement with the DoorDash application has increased, and the infrastructure has also improved. More route density and better technology—leading to faster deliveries and fewer errors—have all contributed to making each order more profitable.

New products: DoorDash’s infrastructure improvements have narrowed the losses from new products. New products have helped drive order volumes and, in time, should also contribute to earnings, because they’re layered onto an existing infrastructure and thus come with high incremental margins. When we first purchased DoorDash, we didn’t view it merely as a food-delivery app, but as a local logistics network. We’re beginning to see that expectation play out, and the most recent example was the partnership announced with home-improvement retailer Lowe’s in early April. Exhibit 5 illustrates these improvements and their results.

Exhibit 5

CASE STUDY: DOORDASH

Sources: YipitData for U.S. market share; Sands Capital estimates for unit economics; DoorDash for new products; and FactSet for 2019 and 2023 net margin; Sands Capital estimate for 2028 net margin. Data as of 12/31/23. MAUs represents monthly active users. New Vertical refers to DoorDash services outside of core restaurant delivery. 2028 Est. represents Sands Capital’s estimate for 2028.

This story of underappreciated fundamental improvement isn’t unique to the United States. MercadoLibre—Brazil’s market-leading ecommerce provider—has also experienced a combination of falling competitive intensity and operational improvements. We estimate that MercadoLibre’s market share in Brazil has grown from 30 percent in 2021 to 40 percent in 2023, driven by a combination of its improving logistics services and the country’s high interest rates, which have crippled competitors.

This improved competitive position, along with a growing contribution from advertising revenue, has driven operating leverage. The business re-achieved profitability by GAAP standards in 2021. Between 2021 and 2023, its revenue doubled, and its operating income grew fourfold. From here, we expect revenue to grow threefold by 2029, with an over seven times increase in operating income.

This isn’t just a technology-related story. India’s HDFC Bank further extended its market leadership through last year’s merger with mortgage-lender Housing Development Finance, resulting in its holding 16 percent market share of India’s financial system, versus 11 percent pre-merger. While still smaller than the State Bank of India, HDFC Bank is India’s largest private-sector bank by market share and is two-to-three times larger across key operating metrics than its closest private-sector peer.

The merger gives HDFC Bank increased scale, extends its distribution footprint, and completes its product portfolio. The key benefits we expect to see from its stronger market position over the medium to long term include better funding, improved cross-sell opportunities, and operating leverage. Overall, it supports a lower cost of operation and structurally higher profitability than its peers, which is a source of competitive edge in banking in terms of pricing and customer franchise (acquisition, cross-selling, and retention.)

Financial Strength Underpins Earnings Potential

These fundamental improvements have bolstered the financial strength seen at the portfolio level. Financial strength is typically viewed as a defensive characteristic—especially in times of economic distress—but it can also underpin earnings potential. Relative to the broader market, our portfolios—as illustrated using Global Growth—tend to have net cash positions and higher structural margins, enabling investment to fortify their competitive moats and, in turn, long-term earnings potential.

Our businesses, on average, feature net cash positions and high structural margins. These characteristics help enable them to invest to fortify their competitive positions, resulting in higher long-term earnings potential.

Exhibit 6

FINANCIAL STRENGTH HELPS BUSINESSES CONTROL THEIR DESTINIES

For illustrative purposes only. All charts cover the period 3/31/14 to 3/31/24. Values are those of the Global Growth Equity Composite. Net Capital Reinvestment (as % of Sales) quantifies the percentage of sales that’s retained for growth investment purposes. It is calculated as growth capital expenditure (i.e., capital expenditure minus depreciation) plus R&D, minus dividends and net capital issuance, all divided by sales. The index represented will differ in characteristics, holdings, and sector weightings from that of the Global Growth portfolio. The types of businesses that meet our criteria are typically found in sectors levered to consumers, health care, and technology. Similarly, we expect the portfolio to be underweight the more cyclical businesses found in sectors, such as energy and materials.

Compelling Valuations

So why are these businesses underappreciated? One would think that improving fundamental outlooks on top of firm financial foundations would command premium valuations. However, our portfolios offer compelling valuations, given their earnings-led rise. In the case of Global Growth, the portfolio traded just modestly above the MSCI ACWI on a growth-adjusted basis at the end of the first quarter (Exhibit 7), despite significant earnings growth potential, durability, and financial strength.

At a company level, this valuation dynamic is even more apparent, with a significant portion of the portfolio trading at a lower forward price-to-earnings ratio (P/E) at the end of 2024’s first quarter than at the beginning of 2023.

Exhibit 7

GLOBAL GROWTH’S RELATIVE VALUATION IS COMPELLING

Global Growth vs. MSCI ACWI. P/E (NTM) to Exp. EPS Growth (STM) 12/31/08 – 3/31/24.

Source: FactSet. For illustrative purposes only. “P/E to Exp. EPS Growth Ratio” is the NTM P/E ratio divided by the expected STM earnings growth for the portfolio and index. The calculation is inclusive of loss-making companies. “P/E” is price-earnings ratio. “NTM” is next 12 months. “STM” is “second 12 months,” a weighted average of Fiscal Year 2 and Fiscal Year 3 estimates. This enables the comparison of companies with different fiscal year-ends and smooths the effect of near-term distortion caused by events, such as the coronavirus pandemic. STM growth is calculated as a percentage difference in the portfolio’s or benchmark’s weighted average NTM and STM earnings yield (estimated earnings per share/current price). Past performance is not indicative of future results. Growth estimates are not predictors of stock price or investment performance and do not represent past performance. You should not assume that any investment is or will be profitable. The MSCI ACWI is unmanaged, does not reflect the reinvestment of dividends and is not subject to fees and expenses typically associated with managed accounts or investment funds. Sands Capital may invest in securities not covered by the Index.

Appreciating the Underappreciated

Jim Grant, who founded Grant’s Interest Rate Observer, famously said “The key to successful investing is having everyone agree with you—later.” At Sands Capital, we have another saying that works well with Grant’s. We believe that “You must be there, not be getting there.”

In other words, active investors need to own the right businesses for their clients when the fundamentals and potential of these businesses are strong but before their stock prices fully reflect that potential. To do that, we have to see what the market is missing, which today are these underappreciated improving fundamentals.

Disclosures:

The investment results are those of the Global Growth Equity Composite as of 3/31/2024. Returns over one year are annualized. The investment results shown are net of advisory fees and expenses and reflect the reinvestment of dividends and any other earnings. Net of fee performance was calculated by reducing the monthly gross composite return by 1/12 of the highest applicable annual fee of 0.85%. Past performance is not indicative of future results. The MSCI ACWI is unmanaged, does not reflect the reinvestment of dividends and is not subject to fees and expenses typically associated with managed accounts or investment funds. Sands Capital may invest in securities not covered by the Index.

The views expressed are the opinion of Sands Capital and are not intended as a forecast, a guarantee of future results, investment recommendations or an offer to buy or sell any securities. The views expressed were current as of the date indicated and are subject to change. This material may contain forward-looking statements, which are subject to uncertainty and contingencies outside of Sands Capital’s control. should not place undue reliance upon these forward-looking statements. There is no guarantee that Sands Capital will meet its stated goals. Past performance is not indicative of future results. A company’s fundamentals or earnings growth is no guarantee that its share price will increase. GIPS Reports found here

All investments are subject to market risk, including the possible loss of principal. International investments can be riskier than U.S. investments due to the adverse effects of currency exchange rates, differences in market structure and liquidity, as well as specific country, regional and economic developments. The strategy’s growth investing style may become out of favor, which may result in periods of underperformance. In addition, the strategy is concentrated in a limited number of holdings. As a result, poor performance by a single large holding of the strategy would adversely affect its performance more than if the strategy were invested in a larger number of companies.

Company logos and website images are used for illustrative purposes only and were obtained directly from the company websites. Company logos and website images are trademarks or registered trademarks of their respective owners and use of a logo does not imply any connection between Sands Capital and the company.

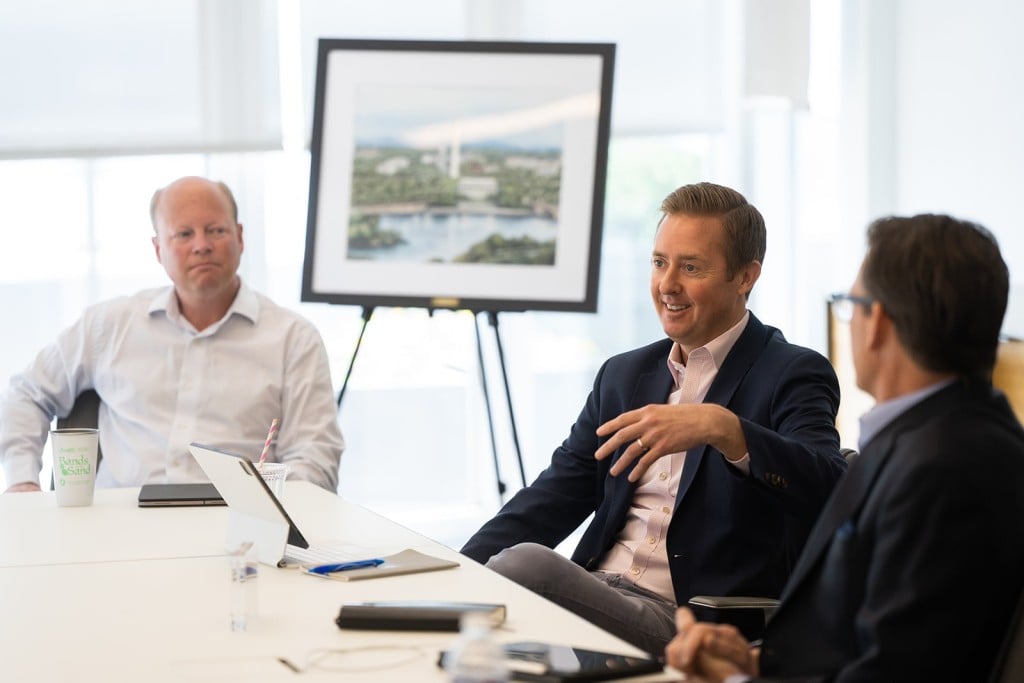
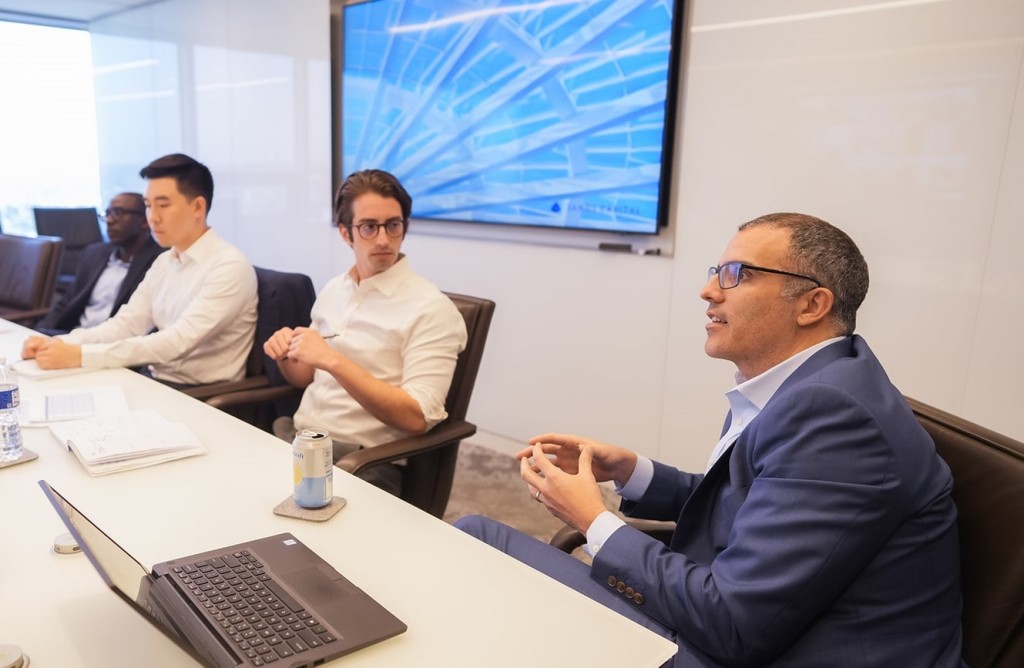
Global Growth takes an unconstrained approach to seeking the best growth businesses anywhere. With the research team free to scour all pockets of the world incubating new ideas, the Global Growth strategy taps into the power of sustainable competitive advantages in both developed and emerging markets.  

 The MSCI ACWI captures large- and mid-cap representation across 23 Developed Markets (DM) and 24 Emerging Markets (EM) countries. With 2,939 constituents, the index covers approximately 85% of the global investable equity opportunity set. DM countries include: Australia, Austria, Belgium, Canada, Denmark, Finland, France, Germany, Hong Kong, Ireland, Israel, Italy, Japan, Netherlands, New Zealand, Norway, Portugal, Singapore, Spain, Sweden, Switzerland, the UK and the US. EM countries include: Brazil, Chile, China, Colombia, Czech Republic, Egypt, Greece, Hungary, India, Indonesia, Korea, Kuwait, Malaysia, Mexico, Peru, Philippines, Poland, Qatar, Saudi Arabia, South Africa, Taiwan, Thailand, Turkey and United Arab Emirates.  The Russell 1000® Index measures the performance of the large-cap segment of the US equity universe. It is a subset of the Russell 3000®. The Russell 1000 Growth Index measures the performance of the large-cap growth segment of the U.S. equity universe. The S&P 500 The S&P 500®tracks the stock performance of 500 of the largest companies listed on stock exchanges in the United States.

Unless otherwise noted, the companies identified represent a subset of current holdings in Sands Capital portfolios and were selected on an objective basis to illustrate examples of market-share leaders in their respective geographies and industries. DoorDash is the largest food-delivery holding across Sands Capital strategies; HDFC Bank is our largest financial services holding in emerging markets; and MercadoLibre is our largest holding in Latin America.

As of March 31, 2024, Alphabet, Amazon, DoorDash, HFDC Bank, MercadoLibre, Meta Platforms, Microsoft, and NVIDIA were holdings in Sands Capital strategies. All companies mentioned were for illustrative purposes only. 

The specific securities identified and described do not represent all of the securities purchased, sold, or recommended for advisory clients. There is no assurance that any securities discussed will remain in the portfolio or that securities sold have not been repurchased. You should not assume that any investment is or will be profitable.

Further Disclosures

Related Articles

Investment Strategy
Delivering Value to the Modern Consumer
Consumer spending is a huge part of the global economy, and we’ve found that businesses that can harness the power of the internet to put their products in front of millions of customers at once have an edge. Research Analyst Katherine Okon explains why she favors those companies that combine digital and physical operations.
Investment Strategy
EM Still Works
Selective active managers should still be able to find value in emerging markets by looking beyond the MSCI Emerging Markets Index. Discover why headwinds that have pressured the asset class are likely to abate.
Investment Strategy
Following the Fundamentals Through Volatile Times
As we continue to emerge from one of the most difficult periods in our history, we are encouraged by the results of our investment strategies. In 2023, we delivered by sticking with our time-tested investment strategy, following our process, doing our research, and executing.
Investment Strategy
Investment Opportunities in Cybersecurity 
For 2024, we have identified eight cyber security trends that most excite us. Read how Sands Capital Ventures Partner Mark McGovern and Principal Chris Eng drew on learnings from key developments across the sector to create their vision for the year ahead.
Investment Strategy
Beyond Distortion and Doubt
Change can create uncertainty in financial markets, but it also has the potential to unlock opportunities for many of the businesses we own. Tune in to hear Sr. Portfolio Manager Dave Levanson, CFA discuss the on-going journey of these businesses, why we continued to own them through tough times, and what we can expect from them going forward.
off
Print